
The earliest effectuated enrollment drop-off data starts to trickle in...


About a month ago, I once again reiterated that the official year over year ACA Open Enrollment Period plan selection drop from OEP 2025 to OEP 2026, which currently stands at around 1.26 million people (23.06M in 2026 vs. 24.32M in 2025) was incredibly misleading for a number of reasons:
Not only are there always some people who never have their enrollment effectuated in the first place due to either the policyholder actively cancelling their policy before it even begins or having it terminated by the carrier due to them not paying their first monthly premium, but that effectuated enrollment can vary widely from month to month due to the “churn” of people either starting or ending exchange coverage.
Each month, some people newly enroll in ACA policies by qualifying for a Special Enrollment Periods (SEP) if they lose their existing coverage, get married/divorce, give birth/adopt a child, turn 26, lose Medicaid eligibility and so on. At the same time, each month other current enrollees drop their policies for a variety of reasons...and in 2026 specifically, I expect the biggest reason by far will be no longer being able to afford to pay their premiums.
I went on to illustrate this by graphing out effectuated enrollment nationally for every month of every year from January 2014 through December 2026, and used this to put together several models projecting how 2026 effectuated enrollment may end up playing out.
My conclusion was that in a best-case scenario, average monthly ACA exchange enrollment in 2026 could end up hitting ~20.9 million (down around 1.5 million vs. 2025)...but that a worst-case scenario could see avg. monthly 2026 effectuated enrollment end up as low as 18.2 million or even lower (down ~4.2 million y/y or even more).
Unfortunately, I also noted that it will be some time before we know what the actual impact of the enhanced subsidies & other administrative changes made by the Trump Regime on effectuated enrollment will be, because, assuming the Centers for Medicare & Medicaid Services (CMS) follows prior years...
The final 2026 Open Enrollment Period report won’t be published until late April/early May
EFFECTUATED enrollment data for the first few months of 2026 won’t be published until sometime in July
AVERAGE MONTHLY effectuated enrollment data for the full year of 2026 won’t be known until sometime in 2027.
The good news is that a handful of the states which operate their own ACA exchange platforms publish effectuated enrollment reports on a regular (usually monthly) basis, including Colorado, Maryland, Massachusetts and Minnesota.
As of this writing, two of these have published monthly reports for both January and February: Maryland & Massachusetts. This means I have at least a little bit of data to work with to try and get an idea of what things might look like nationally as the year progresses.
However, there’s an important caveat: Both of these states offer supplemental state-based premium subsidies which partly cancel out the expired federal tax credits. This means that whatever their effectuated enrollment attrition patterns are in 2026, it will likely be considerably worse for most other states.
With that in mind, let’s take a look.
First, here’s Maryland. While I have effectuated enrollment data for every year dating back to 2016 for every state, in Maryland’s case their reports use a slightly different methodology than CMS: While the official CMS reports only include actual effectuated enrollees, Maryland’s monthly enrollment reports include effectuated enrollees “...plus all new plan selections as of the last day of the month.”
Because of this, I can’t really mix & match the CMS reports with the state ones, so I’m using the Maryland Health Benefit Exchange data exclusively...and it only dates back to 2023:
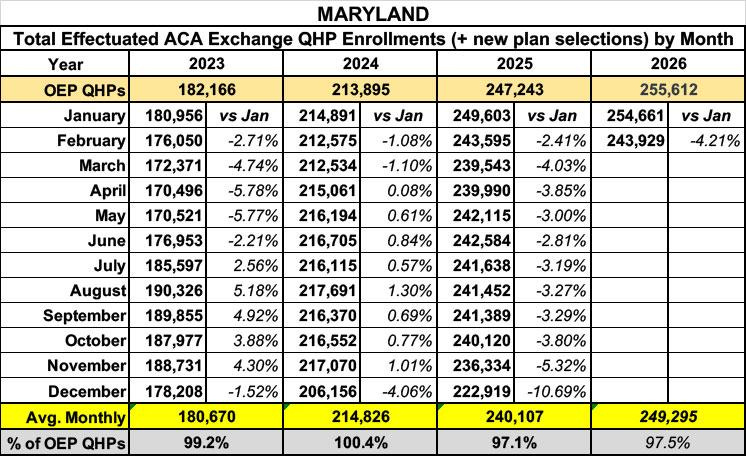
As you can see, even with only two months of data in for 2026, the early indicators aren’t great: Effectuated enrollment in Maryland dropped 4.2% from January to February, a rate 75% higher than the Jan - Feb drop last year, and nearly 4x higher than it was from Jan - Feb 2024.
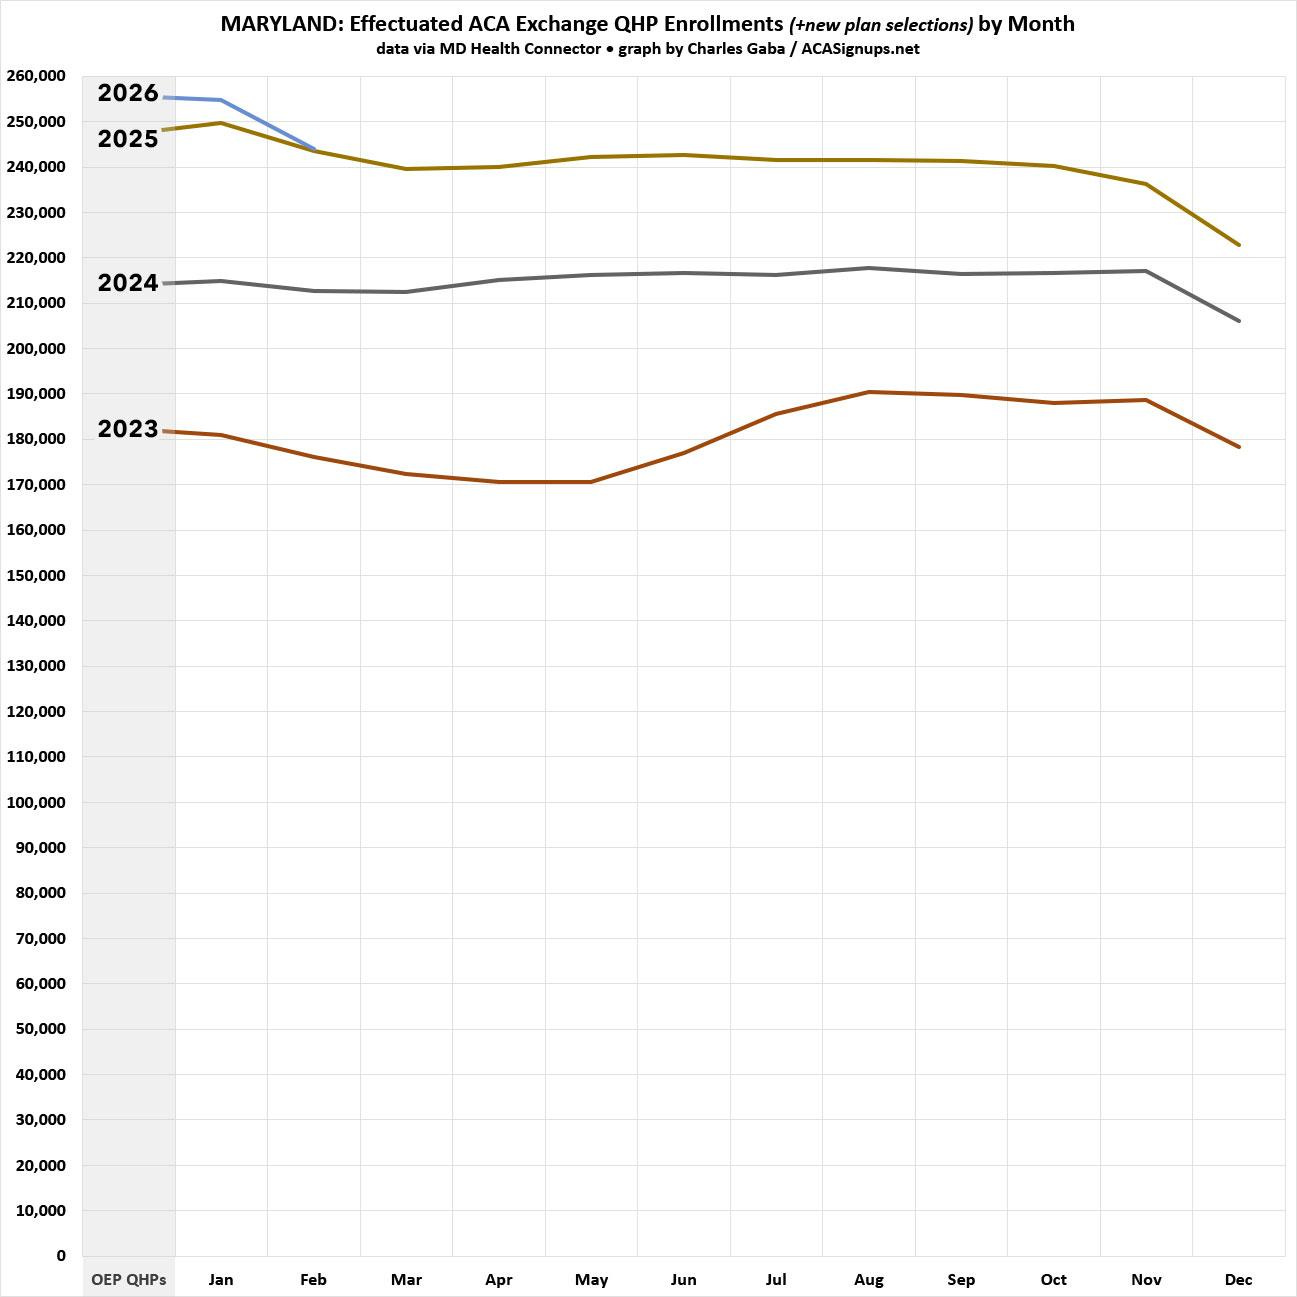
Here’s what this looks like visually...OEP plan selections were actually 3.4% higher for 2026 than 2025, but effectuated enrollment has already dropped to nearly the same level. And while effectuations did jump back up significantly later in the year back in 2023, that’s unlikely to happen this year due to both the subsidy expiration as well as the Trump regime’s elimination of the year-round Special Enrollment Period (SEP) for enrollees who earn less than 150% of the Federal Poverty Level (FPL):
As noted earlier, it’s important to keep in mind that Maryland is offering generous state-based subsidies which are canceling out a huge chunk of the lost federal subsidies for most enrollees:
the state has created a new subsidy program for all ages for those who are under 400% of the federal poverty level to help offset the expiration of the enhanced federal subsidies. The state subsidy program will replace 100% of the enhanced federal subsidies for those under 200% of federal poverty level and will replace 50% of the enhanced federal subsidies for those between 200% and 400% of the federal poverty level.
...In 2025, around 42% of Maryland ACA enrollees...earned less than 200% FPL, and another 32% earned 200 - 400% FPL.
Next, let’s take a look at Massachusetts.
Unlike Maryland, the monthly enrollment data reports from the MA Health Connector appear to only include actual effectuated enrollees (the numbers from 2025 are slightly different from the CMS reports but only nominally so for the most part). That means I should be able to use the CMS data dating back to January 2016, like so:
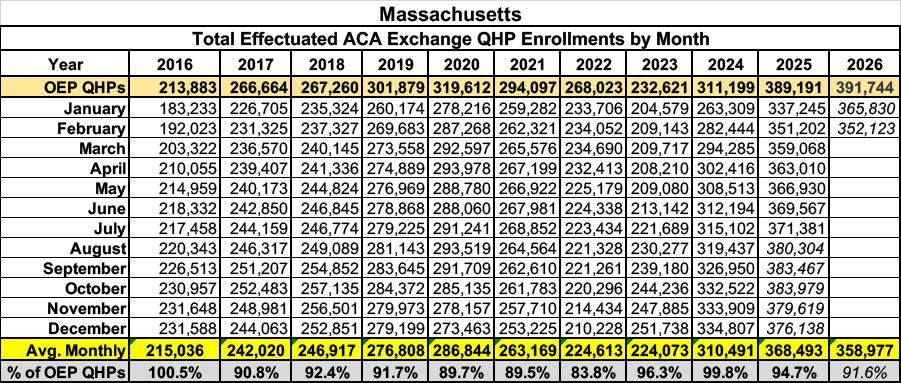
I don’t have the month-over-month percent drop displayed in the table this time, but from January - February 2026 effectuated enrollments dropped 3.7%, compared to a 4.1% increase month over month in 2025. Whoa.
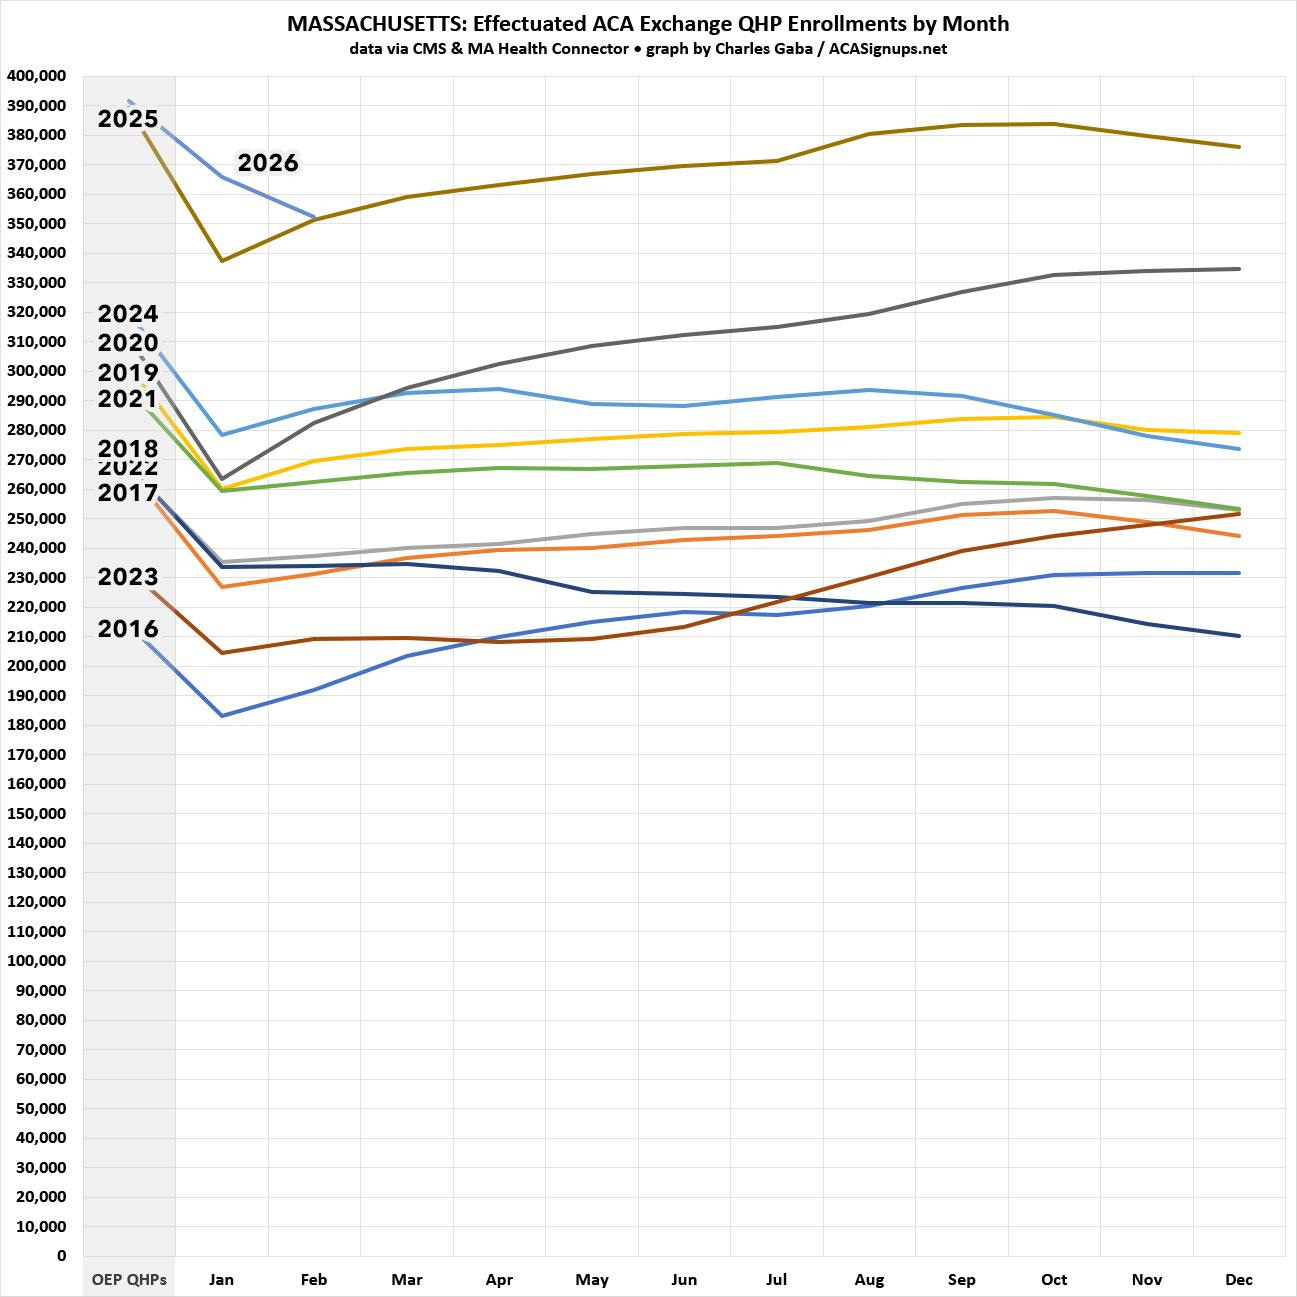
Again, while initial OEP plan selections were higher in 2026 than 2025 (only slightly so this time), as of February they’ve dropped off to virtually the same level they were at as of a year earlier. The question of whether or not effectuations will continue to drop or will instead increase over time is harder to project in Massachusetts, however, due to the Bay State’s unusual “ConnectorCare” program, which not only provides generous supplemental subsidies to enrollees, but which also offers year-round enrollment for most enrollees:
You can enroll any time of the year if:
...You now qualify for a ConnectorCare plan through the Health Connector after not having qualified in the past, or after applying for the first time.
Again, here’s what this looks like visually so far:
I expect both Colorado and Minnesota to post February effectuated enrollment reports within the next week or so and will post a similar look at those as soon as they do so.
Thanks, Charles.
Your post actually got me thinking about "effectuated enrollment", and to double check that that doesn't mess up the thing that I reported on here (and I know you are aware of):
https://normspier828307.substack.com/p/aca-exchanges-i-get-35-million-more
where my conclusion: "ACA Exchanges: I get 3.5 million More (4.7 million) non-returned in 2026 (vs. 1.2 million in 2025)" is still a correct conclusion, in particular the 3.5 million increase, and shows how many people who had exchange coverage last year looked at the prices on the ACA exchanges for 2026, and said "too expensive now--better drop". (I.e., the amount more in the number of people making a decision not to continue coverage for 2025 is 3.5 million.)
(I checked the definitions of the KFF vs CMS numbers in the I was using, and each of the 4.7 million and 1.2 million non-returning numbers I calculated are off a smallish bit due to non-effectuation and people enrolling or unenrolling as each year goes on, but the numbers are off only by the same small, roughly identical, amount, due to identical causal factors. So my "3.5 million more" is fine!
Obsessively, I also tossed on a note on the issue being a non-issue on my post!)
--
-->However, Charles, if you see this comment, you mentioned you have non-effectuation numbers handy since you just used them in an analysis.
If you can plop down a typical percent non-effectuation, say 2024 or 2025 when there is no issue of changing subsidy schedule making the year non-typical, that might help my understanding of the whole business.